Analysis
Fluorescent Labeling Does Not Affect Time to Catastrophe
To show that fluorescent labeling does not affect the time to catastrophe, we compared the labeled and unlabeled tubulin by plotting the ECDFs (with confidence intervals) of the provided data of times to catastrophe. From the display of the ECDFs here, we see that the fluorescent labeling does not make a large difference on the onset of catastrophe since the ECDF plots do not deviate significantly from each other. Then, we computed 95% confidence intervals for the plug-in estimate of the mean time to catastrophe for labeled and unlabeled tubulin. We found there is a strong overlap between the confidence intervals. This indicates that the labeled and unlabeled tubulin result in a similar mean time to catastrophe. We also conducted a permutation test to test our hypothesis that fluorescent labeling does not affect microtubule catastrophe dynamics. The test statistic we chose was the Kolmogorov-Smirnov (K-S) statistic, which computes the maximal distance between the ECDFs of two samples. It is a reasonable and commonplace measure used to determine how different two distributions are. For this test statistic, “at least as extreme as” means that the K-S statistic is greater than what was observed. We computed the p-value of this test to be p = 0.26204 > αα = 0.05. This indicates it is possible to observe this test statistic under the null hypothesis, which states that there is no difference in labeled and unlabeled catastrophe times. We also saw from our graphical analysis that the two distributions look very similar, so we conclude that the measured data for labeled and unlabeled tubulin are very similarly distributed and can be viewed as identical for analytical purposes. Moving forward, we only analyze the time to catastrophe of microtubules growing with fluorescently labeled tubulin. We include the source code to generate this plot as well as the mentioned analysis.
Proposing a Novel Distribution to Model Time to Catastrophe
Although previous work has asserted that microtubule time to catastrophe may be approximated by a Gamma distribution, we are unsure if it is the most appropriate model. It implies that multiple chemical processes with similar rates must occur to trigger microtubule catastrophe. Many factors are important to microtubule catastrophe dynamics/kinetics, like the GTP cap which prevents depolymerization. There is not enough evidence to conclude that time to catastrophe follows a Gamma distribution. We propose an alternative model where we postulate that two biochemical processes will occur in sequence to trigger catastrophe. These processes are both Poisson processes with rates $\beta_1$ and $\beta_2$, respectively. We use a random number generator to simulate 150 catastrophe events with various pairs of $\beta_1$ and $\beta_2$. We include the source code to generate the left plot below.. We note that the more $\beta_2$ is greater than $\beta_1$ , the steeper the ECDF is, which makes sense since catastrophe would trigger faster if the processes occurred faster.
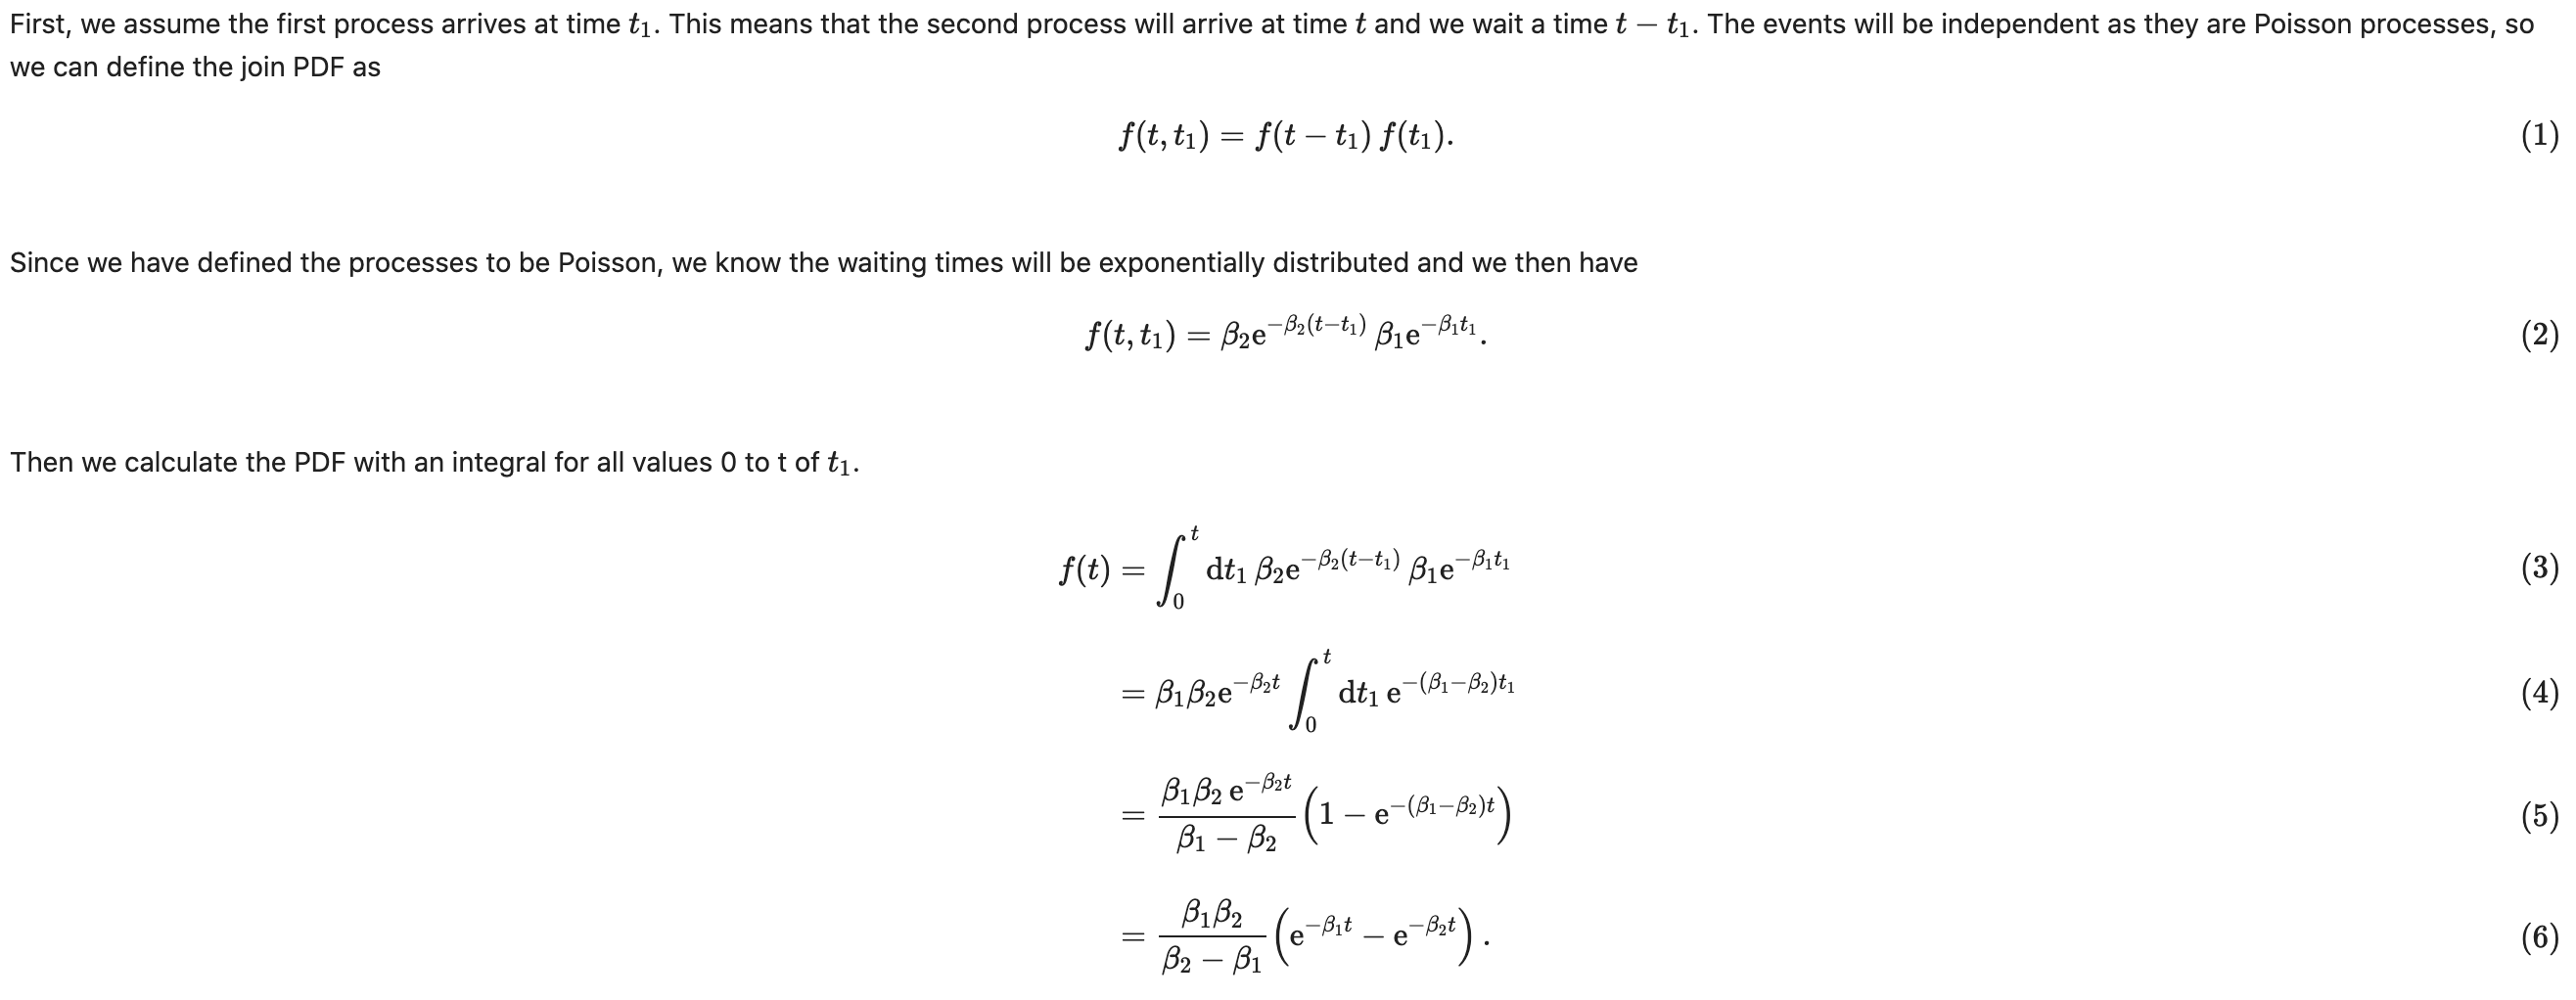
Analytical derivation of time to catastrophe model
We analytically derive the distribution for the time to catastrophe, finding the PDF and CDF for this distribution. We then compared the analytical CDF with the ECDFs from our previous simulation to confirm that they match. We include the source code to generate the right plot above. We can then use this analytical PDF or CDF to compare this model to a Gamma distribution to see which is more appropriate to model time to catastrophe.
Derivation Work
Comparing Our Proposed Distribution With a Gamma Distribution
Next, we will analytically compare the distribution we proposed, the two consecutive Poisson processes, with the gamma distribution. We overlayed the predictive ECDFs for both distributions with the ECDF of the measured data of microtubule time to catastrophe for 12uM of fluorescently labeled tubulin (made available to us via Justin Bois). We find that the ECDF of the Gamma distribution matches as well with the measured ECDF as our proposed distribution. Furthermore, we also plot the difference between the predictive ECDF and the measured ECDF to more clearly see how far apart the ECDF values of the predictive ECDFs are from the actual data points. We find that the difference between our proposed distribution and the measured data is larger than that of the Gamma distribution. Then, we use the AIC, which can be broadly understood as an estimate of a quantity related to the distance between the true generative distribution and the model distribution. Given two models, the one with the smaller AIC value is likely closer to the true generative distribution. We then compute the AIC for both and find that our proposed model consisting of two Poisson processes (AIC value on the order of $10^{-11}$ is less likely to be as close to the measured data as the Gamma Distribution.
Summary
From the data provided to us by the Howard Lab, we were able to compare a novel model of microtubule catastrophe to the Gamma Distribution. Our novel model is defined as two sequential biochemical processes which are Poisson and trigger microtubule catastrophe. Through graphical and statistical analysis, we conclude that our proposed model is not as appropriate to model time to catastrophe of microtubules compared to the Gamma Distribution.